


Recognizing and understanding that ticket holders are not only ideological, but also profit-motivated actors is important to the analysis within. It also helps better understand the relationship between users, tickets, and the ticket pool
By Permabull Nino - Feb 11, 2020 - A Tool for Gauging User Sentiment

Introduction & Roadmap
On-chain analysis is a nascent and emerging field of study within the cryptocurrency space and within the ledger analysis space at large, which includes traditional work done by internal accountants, auditors, and consultants alike.
Among these ledger data specialists reigns one overarching principle: establish / identify economic truth via thorough research, and communicate findings in a digestible manner for outside parties to engage with.
The work of internal accountants / auditors emerges at various financial reporting deadlines, and consultants shine via their various deliverables to their clients.
Cryptocurrency on-chain analysts aim to establish and communicate economic truths about the public ledgers of their choice via reports such as these. With this in mind, the previous pieces within the “Decred On-Chain” series explored and established the following:
(1) Decred On-Chain: A Look at Block Subsidies
- Public ledgers are digital entities that leverage block rewards to incentivize / bootstrap growth
- Block rewards are fundamental to network valuation
(2) Decred On-Chain: The Ticket Pool VWAP
- Cost basis that flows within the proof of stake ticketing system impacts user behavior and ultimately reflects itself in short / long term price action
(3) Decred On-Chain: HODLer Conversion Rates
- DCR flows dominated by HODLers, marginal buyers, and marginal sellers reflects itself in short / long term price action
In an attempt to further explore the dynamics of the Decred blockchain, we will aim to establish the following truth within this piece:
The plan of attack goes as follows:
(1) Overview of Tickets & the Ticket Pool
(2) Rate of Return for Tickets
(3) The Bitmex Perpetual Swap
(4) Similarities Between Tickets and the Bitmex Perpetual Swap
(5) Ticket Funding Rates Baselines
(6) Ticket Funding Rates Calculation
(7) Ticket Funding Rates Charts & Analysis
(8) Conclusion
Overview of Tickets & the Ticket Pool
For more detailed dives on the mechanics of tickets please give the Decred Documentation and Decred On-Chain: The Ticket Pool VWAP a read.
For purposes of this piece, a higher level overview will suffice. Decred tickets serve the network in the following ways:
- Provide a second layer of security for the network
- Establish a means to gauge network-wide consensus for on-chain voting
- Establish a means to gauge consensus for off-chain voting on allocation of treasury funds
The network incentivizes users to lock up DCR stake in tickets by offering:
- Rights to participate in on-chain and off-chain governance
- Block rewards
Recognizing and understanding that ticket holders are not only ideological, but also profit-motivated actors is important to the analysis within. It also helps better understand the relationship between users, tickets, and the ticket pool, which goes as follows:
- The target ticket pool size is 40,960 tickets
- Users’ demand for tickets fluctuates, which either (1) pushes the actual ticket pool size above the target pool size or (2) pulls the actual ticket pool size below the target pool size
- This demand for tickets (or lack thereof) causes the staking difficulty algo to adjust ticket price upwards or downwards
- Block rewards consistently decay at ~1% every 6,144 blocks (3 weeks approximately)
- These increases / decreases in ticket prices and block rewards cause changes in the Return on Investment (ROI) for tickets over time
Ticket ROI ultimately reflects user demand to hold not only tickets, but DCR coins themselves, and this demand emerges in DCRUSD & DCRBTC price action
Rate of Return for Tickets
The ROI calculation for a Decred ticket is below:

Over time, tickets are naturally designed to provide a diminishing ROI as a function of:
- Ticket Price Increasing — Which occurs with more DCR issued into circulation to buy tickets with, and an increasing demand to hold tickets as the network becomes more valuable / matures
- Block Rewards Decreasing — The DCR issuance schedule dictates a consistent block reward decrease until block rewards become negligible at around 21 million DCR
This ticket price and block reward dynamic is illustrated in the chart below:
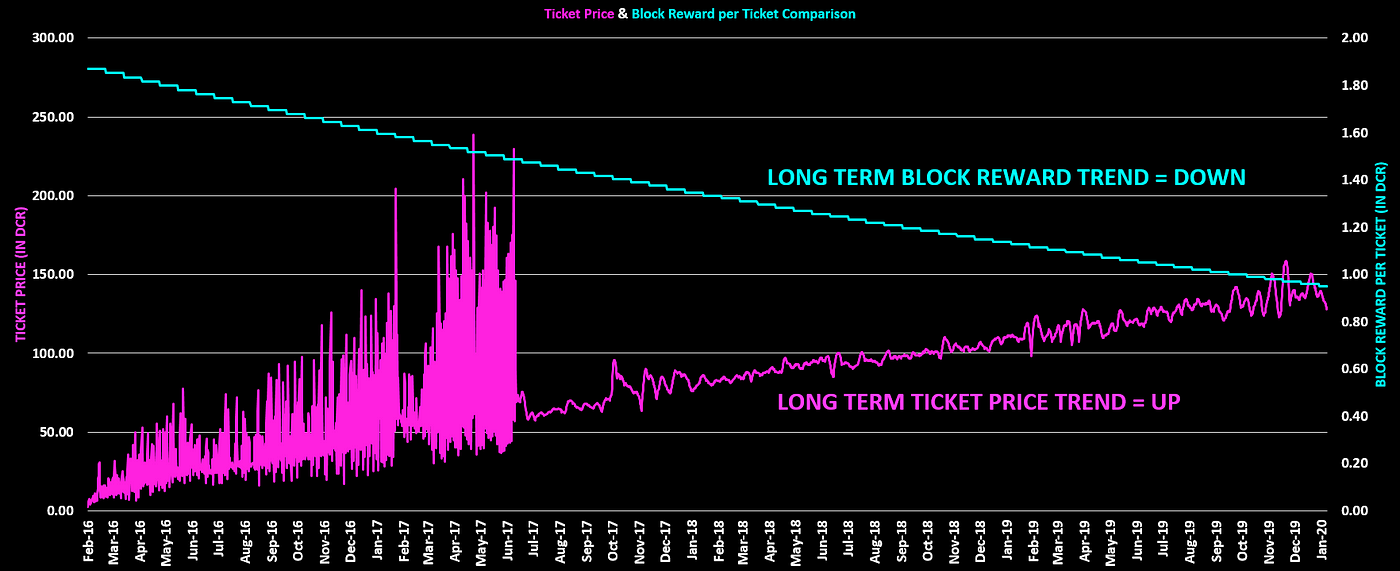
- As can be seen, the long term trends for (1) ticket prices and (2) block rewards are consistently upwards and downwards, respectively
- The shorter term trends for ticket prices are not as consistent, and provide an opportunity for further analysis
- February 2016 — Summer 2017 was a choppy period for tickets (as a result of the original Proof of Stake Difficulty Algo issues) and thus makes analysis substantially more difficult for this period
The Bitmex Perpetual Swap
In this section we will provide a brief overview of the Bitmex perpetual swap. Understanding this derivative product, its mechanics at a high level, and relation to Bitcoin price action is important as it is what partially inspired the analysis / tools that follow in later sections.
Per the Bitmex website:
“A Perpetual Contract is a derivative product that is similar to a traditional Futures Contract, but has a few differing specifications:
There is no expiry or settlement.
Perpetual Contracts mimic a margin-based spot market and hence trade closeto the underlying reference Index Price.
This is in contrast to a Futures Contract which may trade at significantly different prices due to basis.
The primary mechanism to tether to spot price is Funding.”
Our primary concern for this piece is the tethering of the perpetual contract to the underlying spot price index, funding’s role in accomplishing this, and how this manifests itself in Bitcoin price movements. A more specific explanation of (1) Funding and (2) Funding Rates will help in bolstering this understanding:
- Funding: Periodic payments exchanged between the buyer and seller every 8 hours. If the rate is positive, then longs will pay and shorts will receive the rate, and viceversa if the rate is negative.
- Funding Rates: Aims to keep the traded price of the perpetual contract in line with the underlying [spot] reference price.
- Note: In cases where the perpetual contract trades at a premium / discount to the underlying [spot] reference price, funding rates will adjust to push the contract closer to the underlying.
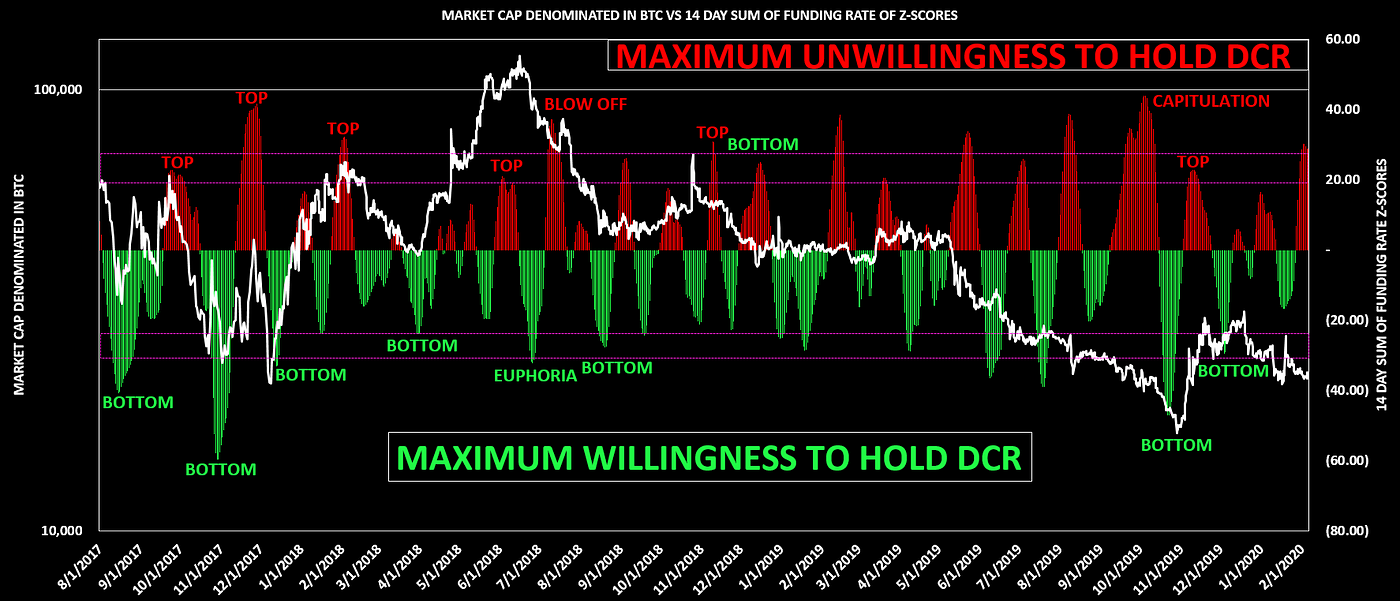
Since funding rates represent the interest rates paid between buyers and sellers, it is fair to conclude that higher / lower rates in favor of buyers or sellers are also indicative of increased / decreased demand for Bitcoin exposure. At the extremes, these rates should in theory serve as a tool for gauging market sentiment, which can be observed in the chart below:
Based on the chart above, and in line with expectations— when the funding rates / premium index reach extremes, the Bitcoin price has topped or bottomed during such periods, as these represent maximum willingness or unwillingness to take on Bitcoin exposure for traders / investors. This rationale, accordingly with sentiment and market dynamic, will be the approach and point of focus for analyzing the rate of return for Decred tickets.
Similarities Between Tickets and the Bitmex Perpetual Swap
There’s an interesting sphere of overlap between Decred tickets and the Bitmex perpetual swap:
- Decred tickets also aim to maintain a tether, by oscillating around the target ticket pool size of 40,960 tickets
- Ticket price changes in order to correct any differences between the actual ticket pool size and the target pool size
- Ticket price changes affect the rate of return for a ticket, which incentivizes/disincentivizes people to purchase tickets. This mechanism in turn increases/decreases ticket pool size back to the target pool size as needed — similar to how Bitmex funding rate fluctuations incentivize more or less people to go long/short

The goal of this comparison is only to show that the funding rate approach to analyzing the Decred ticket ROI is reasonable as:
- There’s a tether maintained within the Decred ticket system
- There’s a mechanism for maintaining the peg and
In theory, extreme moves outside the tether should represent the edges of Decred sentiment, willingness to hold tickets, and overall willingness to hold DCR
Ticket Funding Rates Baseline
When performing on-chain research it is useful to come up with a hypothesis, and subsequently identify the “lowest hanging fruit” to prove the hypothesis correct before doing more detailed / time-consuming analysis.
For purposes of this article the lowest hanging fruit for proving demand for tickets did indeed move with Decred prices was picked off via comparing the 28-day ticket volume sum (denominated in DCR) versus the 142-day ticket volume sum (also denominated in DCR) as a ratio, and plot the DCRBTC price to see where tops and bottoms occurred:

Although not a perfect tool, the chart above does provide sufficient evidence to support that there is a relationship between (1) Decred price action and (2) demand for tickets, with DCRBTC prices topping and bottoming on multiple occasions when short term ticket demand has been in “overbought” or “oversold” territory.
Note: Plotted series starts at February 2018 for this chart as there was an adjustment period following the change to the new Stake Difficulty Algo.
Now that the minimum requirements to move forward have been satisfied — it’s time to explore Ticket Funding Rates. Before providing calculations, charts, and analysis for the funding rates, a few reminders are necessary:
- The rate of return for tickets is constantly decaying over the long term, so focusing on shorter timeframes is necessary to eliminate the downward bias in data
- Ticket demand is a sentiment indicator, and shows not only a willingness to hold tickets, but also DCR
- This sentiment is neither bullish nor bearish on a stand-alone basis, just a tool that is useful to evaluate in context of other information available from an on-chain and technical analysis perspective
- Ticket data from February 2016 — Summer 2017 is a bit noisy due to the previous Staking Difficulty Algo, so the tools / analysis will focus on the period from August 2018 — January 2020
These points will provide context to not only the calculations, but also to the readers’ personal analysis of the Ticket Funding Rates alongside DCRUSD & DCRBTC price charts.
Ticket Funding Rates Calculation
Calculation for the Ticket Funding Rates have 3 steps:
Funding Rate

- Current Period Ticket ROI versus the 28 Day Average Ticket ROI provides a basic gauge to determine how willing people are to hold tickets today versus the short term trend
- Negative Funding Rate = Demand for tickets is relatively high, as Current Period ROI < 28 Day Average
- Positive Funding Rate = Demand for tickets is relatively low, as Current Period ROI >28 Day Average
Daily Z-Score Versus 28-Day Funding Rate Mean

- Funding Rate Z-Score calculation shows how normal / abnormal a certain funding rate is within a 28-day window
- Using a z-score approach also provides normalized values, which will be important for the final step…
14-Day Sum of Z-Scores
- Taking a rolling 14-Day Sum of Z-Scores allows the user to gain some perspective on “aggregate sentiment” for Decred, whereas a single instance of sentiment can be noisier for analysis
- Summing z-scores ensures that values used are apples-to-apples in what is a constantly changing data set
Ticket Funding Rates Charts & Analysis
The rolling 14-Day Sum of Z-Scores, with the DCRUSD & DCRBTC price charts overlaid, are below:

General Analysis:
Lightly drawn purple boxes in both charts show the maximum willingness / unwillingness to hold DCR, as the aggregate z-score sums reach large peaks in this zone
Smaller aggregate z-scores have historically been areas of low conviction selling / buying, and generally met with trend continuation
Aggregate z-score peaks have historically been places where price action pivots and changes direction
Strong sentiment = fuel to support large prices moves, or even trend-changing price action
Green = Maximum Willingness to Hold DCR
Red = Maximum Unwillingness to Hold DCR
*Generally*, Green values put in the bottoms, and Red values put in the tops
This tool is particularly useful during trending markets as it can help identify euphoria / caution setting in during strong uptrends, and capitulation / value-buying emerging during strong downtrends
Detailed Chart Analysis:
August 2017 — September 2018 was a trend heavy market, which resulted in extreme shifts in sentiment. These extreme values throughout this period coincided with multiple market tops and bottoms, as can be seen in the DCRBTC chart
Q2-Q3 2019 showed heavy volatility in sentiment as DCRBTC made new lows, with multiple instances of heavy “buying of the dip” followed by stronger negative sentiment pushing price to new lows. The DCRUSD chart shows that the peaks in aggregate z-scores coincided with tops / bottoms during this period
Q4 2019 shows capitulative characteristics, with extreme unwillingness to hold DCR in early October followed high-conviction willingness to hold DCR in late October
Current sentiment = large unwillingness to hold tickets, as DCRBTC chops around and tries to establish a higher lower after its Q4 2019 v-bottom. Extreme sentiment emerging like this indicates consolidation after the v-bottom might be close to over
Conclusion
The goal for this piece was to establish tickets as an indicator for sentiment within the Decred network, and evaluate how this sentiment reflects itself in price action over time.
As time progresses this idea will be put to the test, but early evidence suggests a correlation between ticket prices, ROI on tickets, and DCRUSD/DCRBTC price action.
Signing out,
Huge thank you to Ammar Naseer & Oke Pearson for their feedback on this piece.


Comments ()