

Decred On-Chain: HODLer Conversion Rates
Establishing the relative balance between ticket and non-ticket transactions on-chain, we can establish high conviction signals on the health of the network and a toolkit for determining price trends.

By Permabull Nino - Jan 6, 2020 - Tracking Accumulation & Capitulation Momentum On-Chain
Introduction / Roadmap
In previous pieces “Decred On-Chain: A Look at Block Subsidies” & “Decred On-Chain: The Ticket Pool VWAP” we laid down and explored the foundational bits of the Decred network and its relationship to (1) its block rewards and (2) its proof of stake ticketing system.
At a high level, the goal of these two pieces were to establish a baseline for more detailed / granular analysis in future research. This piece builds off these concepts and ideas, with a focus on DCR ticket data attributable to:
(1) DCR Hodlers
(2) Marginal Buyers / Sellers
Establishing the relative balance between ticket and non-ticket transactions on-chain, we can establish high conviction signals on the health of the network and a toolkit for determining price trends. This toolset for analysis will be herein referred to as “HODLer Conversion Rates”. The approach to our analysis goes as follows:
(1) Concepts Relevant to HODLer Conversion Rate Analysis
(2) History of Decred’s Proof of Stake Difficulty Adjustment Algorithm
(3) Raw HODLer Conversion Rate
(4) Adjusted HODLer Conversion Rate
(5) Concluding Analysis + Final Thoughts

Concepts Relevant to HODLer Conversion Rate Analysis
The genesis of research on HODLer Conversion Rates stems from the analysis of the 142-Day Cap and the Realized Cap in “Decred On-Chain: The Ticket Pool VWAP”. Within such piece there was a discussion which covered the following points:
- 142-Day Cap captures 142 days of ticket transacting
- Realized Cap captures 142 days of ticket + standard transacting
- Realized Cap > 142-Day Cap = Accumulation Premium (Bullish)
- Realized Cap < 142-Day Cap = Capitulation Discount (Bearish)
- Ticket Buying = HODLers
- Standard Transactions = Accumulators or Capitulators

Decred is unique in that it is the only network that so explicitly allows us to identify the difference between HODLers, Accumulators, and Capitulators with very little issue — and the 142-Day Cap vs Realized Cap comparison provides insight to this balance between network participants.
While the 142-Day Cap and Realized Cap comparison provides a key insight and tremendous value, it left a few unanswered questions:
- Crossovers of the two values do a great job of confirming trends, but struggles with catching them early i.e. identifying when momentum shifts— how can we improve this?
- The May — July 2018 Decred pump retested all time highs while the rest of the crypto space had moved into a period of bearish price action. However, 142-Day Cap vs Realized Cap comparisons suggests it was not a pump driven by new marginal buyers and sellers. With this in mind — the 142-Day Cap and Realized Cap cross can lag at times so we need to take this into consideration — how can we confirm if the run up was driven by marginal buyers / sellers on-chain, or if it was largely a pump driven by short term traders?
In the final three sections within we will perform various analyses which will provide tools to identify trend changes early, and lend further insight to the conditions surrounding the Decred run up during May — July 2018.
However, before we do so — we need to quickly discuss Decred’s Proof of Stake difficulty adjustment algorithm…
History of Decred’s Proof of Stake Difficulty Adjustment Algorithm
There are two staking epochs in Decred’s history to date:
- Epoch 1: Block 4,096 — Block 149,248
- Epoch: Block 149,248 — Now
These two epochs are defined by different staking difficulty algorithms, as is evident in the chart below:
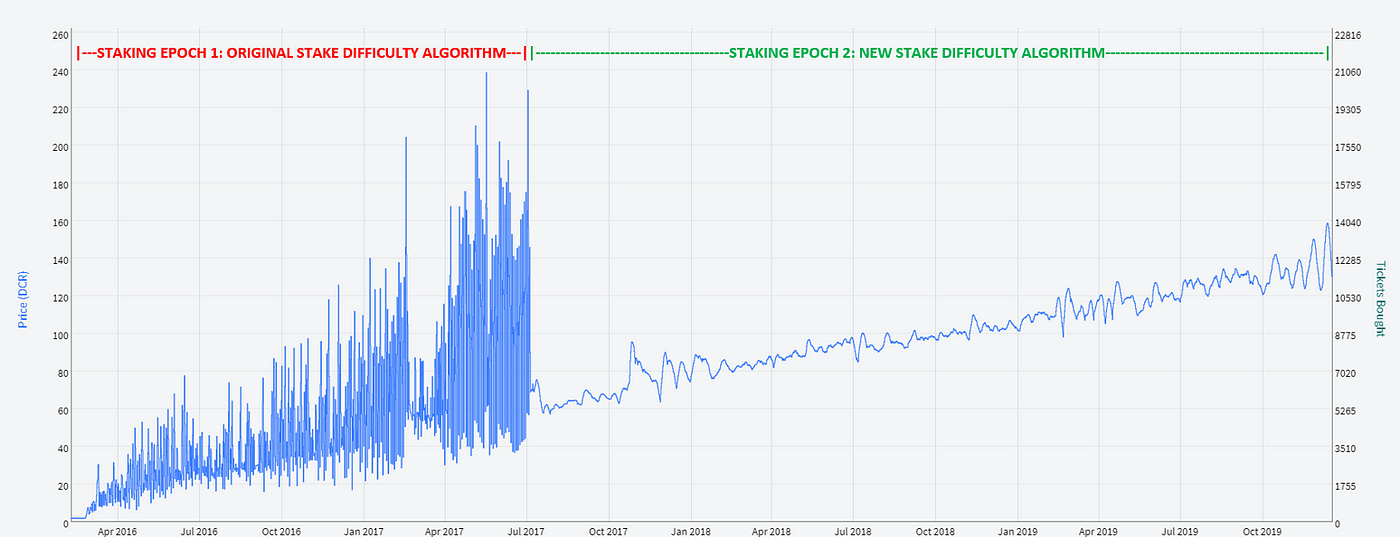
As can be seen, the change in staking difficulty algorithm was more than a cosmetic change for the network — it impacted day to day pricing of tickets massively. The issues with the original staking difficulty algorithm are best summarized by Dave Collins in DCP0001 - New Stake Difficulty Algorithm:
“The current stake difficulty algorithm [Epoch 1] satisfies the dead minimum requirement of maintaining a relatively stable ticket pool size which is important since the ticket pool size growing too large or too small can substantially alter the social contract between stakeholders and the network, disrupting the predictable nature of average time to vote a ticket, percentage of tickets that expire, and, consequently, the expected rate of return.
However, the current algorithm [Epoch 1] also exhibits several shortcomings. Most notably, it allows the prices to swing too wildly which encourages all tickets to be purchased during a single interval when the price is artificially low, followed by discouraging any purchases at all for several intervals due to the price becoming artificially high. In short, very limited price exploration occurs which leads to several undesirable outcomes and behaviors such as a poor user experience due to intense fee competition during the single interval where tickets can reasonably be purchased and huge swings in mining hash power since miners direct large amounts of hash power at the network during the high fee interval and remove it after the interval is over.”
The volatility in ticket prices naturally impacted the ticket purchasing volume over short timeframes, which ultimately caused a deviation from network staking targets over the first staking epoch:
- Target Ticket Pool Size: 40,960 tickets
- Actual Average Ticket Pool Size: 42,000–43,000 tickets
In a close to perfect world, the ticket pool size should be very close to equal to the sum of 28 days of ticket volume. During staking epoch 1 that proved to not be the case, whereas staking epoch 2 has shown a much closer fit between the two.
It seems the cause for this spread during staking epoch 1 can be attributed to the volatility in ticket purchasing, with many instances of the absolute maximum number of tickets (2,880 tickets) being purchased during a 144 block staking window — flooding the ticket pool very quickly and pushing stake participation beyond the 40,960 ticket target. This seems like a reasonable conclusion because:
- The average 28 day sum of ticket purchases only differ by ~0.3% (both around 40,600 tickets purchased over 28 days) between epochs 1 and 2
- The difference in average ticket pool size differs by ~4% between epochs 1 and 2
- This is a large gap in average ticket pool size when considering the ticket buying over a 28-day span is near equal in both staking epochs
- Note: This comparison and calculation for these bullet points is done from blocks 15,000–150,000, in order to provide time for staking to stabilize in the Decred network’s early days
Below we have a chart that highlights this disparity, showing the % spread between:
(1) Number of tickets purchased in a rolling 28 day window (TRANSACTED in tickets)
(2) Actual average ticket pool size (currently LOCKED in tickets)
Please note — this is smoothed over 28 days to give us a clear picture of the trend and begins at block 15,000, which is around when staking conditions started to level out. Note how around block 150,000 (when new stake difficulty algorithm went live on mainnet) the % spread starting correcting itself and moving towards 0%:

- The number of tickets purchased in a rolling 28 day window differs from the actual average ticket pool size quite notably in Staking Epoch 1
- The number of tickets purchased in a rolling 28 day window has been near equal to actual average ticket pool size during Staking Epoch 2.
- This difference between the two epochs will come into play when we explore the Adjusted HODLer Conversion Rate.
In the second staking epoch to date, the actual average ticket pool size has been ~40,960 tickets and ticket purchasing volume volatility has leveled out substantially, which can be seen in the two previously shown charts. Overall, the switch to the new staking difficulty algorithm has been very successful and has brought stability to Decred’s staking ecosystem.
This overview and information is relevant to our analysis in future sections for the following reasons:
- For on-chain analysis our goal is to find the signal through the noise. However, in the first staking epoch, the data proved to be noisy so we need to make adjustments to ensure we’re evaluating the data appropriately
- In section 4, the Adjusted Hodler Conversion Rate, we will be not only comparing (1) % of Total DCR MOVED ON-CHAIN Attributable to Tickets, but also (2) % of Total DCR Supply TRANSACTED / currently LOCKED in Tickets
- As is evident with our analysis thus far — the Total DCR Supply TRANSACTED in Tickets was not equal to Total DCR Supply LOCKED in Tickets during Staking Epoch 1, which impacts the message the data provides during this time period
Raw HODLer Conversion Rate
Our focus in this section will be on the raw % of DCR moved on-chain attributable to tickets, which will provide baseline insights into the proportions of transactions attributable to HODLers, accumulators, and capitulators on the Decred network.
Analysis is undertaken utilizing 28 & 142 day timeframes, which are selected for the following reasons:
- 28 days: Number of days it takes to theoretically fill up the ticket pool and long term average vote period for tickets
- 142 days: Number of days it takes to ensure every ticket in the ticket pool has either voted or expired without voting
It’s important to evaluate comparative DCR flows over intermediate and extended time periods because it allows us to assess the direction and shift of network momentum, and also helps give us perspective on the magnitude of single large transactional instances relative to the quieter periods that surround it.
In order to ensure there’s no confusion, the calculation for the Raw HODLer Conversion Rate is as follows:

The significance of this calculation is provided below:
Decred tickets set the baseline minimum for DCR throughput on the Decred network. Fluctuations in DCR throughput are thus largely related to an increase / decrease in standard transactions taking place on the network. Thus, these fluctuations show how much marginal buyers / marginal sellers are interested in DCR, and it’s important to pay attention to this group because they are the ones who ultimately set the market price.
The 28-Day HODLer Conversion Rate vs the DCRUSD Price is plotted below:

- The 28-Day HODLer Conversion Rate is incredibly active and responsive — with many dips downwards in the rate, indicative of high interest from marginal buyers and sellers
- Spikes upwards in the rate show periods of little interest from marginal buyers and sellers
- Small nodes of % spikes in the HODLer Conversion Rate are normal for even bullish market conditions
- Extended periods of high rates (January 2018 — January 2019 & April 2019 — October 2019, as examples) which are substantially more concerning and indicative of sustained bearish momentum
The 142-Day HODLer Conversion Rate paints a similar, but more zoomed out picture:

- Although less responsive, the trend remains: extended periods of high HODLer Conversion Rates are inversely related to price.
- Periods where HODLer Conversion Rate > 50% have historically been indicative of bearish momentum
- Periods where HODLer Conversion Rate < 50% have historically been indicative of bullish momentum
The 142-day HODLer Conversion Rate hovering around the 40% — 50% range for the past few years is worth noting, and brings merit to the idea that % of DCR moved on-chain attributable to tickets may run very closely to the % of DCR supply staked in tickets. Our test for this is shown in the chart below:

The test confirms expectations— the % of DCR moved on-chain attributable to tickets has indeed followed the % of supply transacted / locked in tickets.
Adjusted HODLer Conversion Rate
In this section we will analyze the 28-Day and 142-Day Adjusted HODLer Conversion Rate, and evaluate its ability to identify trend changes in both the DCRUSD & DCRBTC charts.
An adjustment calculation is required to account for the imbalance between the staked supply (DCR in the ticket pool) and the DCR flowing through new on-chain ticket purchases during Epoch 1. Furthermore, an adjustment needs to be made to take into account that DCR ticket flows change as the ticket pool increases / decreases in size over time.
As such, we will do two separate calculations to show how using % of supply LOCKED in tickets could have led you astray during staking epoch 1, but proved reliable and can continue to be used during staking epoch 2 as a result of the new staking difficulty algorithm.
We will call the two calculations (1) Theoretical Adjusted HODLer Conversion Rate and (2) Actual Adjusted HODLer Conversion Rate:
(1) Theoretical Adjusted HODLer Conversion Rate:

(2) Actual Adjusted HODLer Conversion Rate:

This calculation is relevant and useful for the following reasons:
- This allows us to gauge whether the network is relatively overweight or underweight marginal buyers and sellers (non-ticket transactors)
- Ticket flows dominate a large portion of DCR moved on-chain
- Ticket-allocated DCR dominate a large portion of DCR outstanding supply
- Overcoming this dominance requires a significant amount of DCR moved from marginal buyers / sellers, which is what makes peaks / troughs noteworthy
Also, please note the following:
- Positive Adjusted HODLer Conversion Rate = Network overweight HODLers, which is bearish
- Negative Adjusted HODLer Conversion Rate = Network overweight marginal buyers and sellers, which is bullish
The DCRUSD & DCRBTC 28-Day Theoretical & Actual Adjusted HODLer Conversion Rates are as follows:

28-Day DCRUSD & DCRBTC Theoretical / Actual Adjusted HODLer Conversion Rate Takeaways:
(1) Theoretical Adjusted HODLer Conversion Rate remained bullish from launch until the altseason top in summer 2017, since then it’s proven to flow between surplus and deficit more often. Actual Adjusted HODLer Conversion Rate was bearish during this period.
(2) A series of four higher lows in late 2017 showed early signs of marginal buyers and sellers losing interest
(3) Remained bearish for the entirety of the summer 2018 DCRUSD / DCRBTC run-up, suggesting upwards price movement was not from new buyers but in reality driven by traders. Also turned bearish at the January 2018 crypto market top
(4) Remained almost completely bearish until January 2019. Also worth noting that the magnitude of its few bullish flips were minute and thus provided very little to be bullish about as far as expecting an overall market reversal is concerned
(5) Flipped bearish March / April 2019 and remained so until October 2019. This marked a period of continued bearish DCRBTC price action
(6) Decred’s most recent bottom registered one of the lowest Adjusted HODLer Conversion Rates since early 2017
Overall: The 28-Day Adjusted HODLer Conversion Rate is great for catching trend changes early and the magnitude of its surpluses and deficits should be taken into account when evaluating for possible early trend changes
The DCRUSD & DCRBTC 142-Day Theoretical & Actual Adjusted HODLer Conversion Rates are as follows:
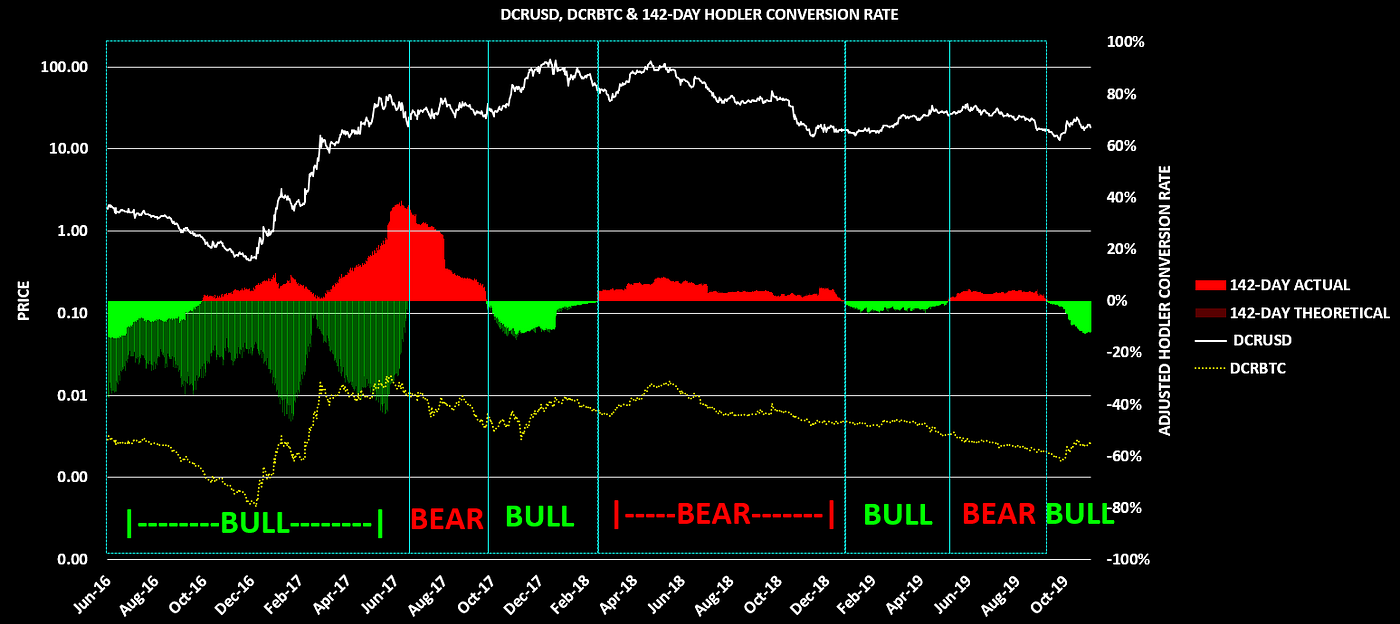
142-Day DCRUSD & DCRBTC Theoretical / Actual Adjusted HODLer Conversion Rate Takeaways:
(1) Remained bullish until the May— July 2017 altseason top
(2) Remained bearish from March 2018 until February 2019, suggesting marginal buyers and sellers were absent for the entire USD bear market in crypto
(3) Flipped bearish early May 2019, signalling an extension of bearish DCR conditions through late 2019
(4) Actual Adjusted HODLer Conversion Rate signaled bearish conditions through July 2017 whereas Theoretical Adjusted HODLer Conversion Rate signaled bullish conditions until July 2017. Since then, both rates have been almost completely equal.
Overall: The 142-Day Adjusted HODLer Convresion Rate rarely transitions between bullish and bearish, and thus best serves as a macro indicator for DCR demand. Furthermore, the Actual Adjusted HODLer Conversion Rate, which uses % of supply in ticket pool to establish a minimum benchmark for determining marginal buyer / seller appetite for DCR, can be used over the Theoretical Adjusted HODLer Conversion Rate (which was needed for Staking Epoch 1).
Concluding Analysis + Final Thoughts
This piece is best summarized with a chart that includes the Adjusted HODLer Conversion Rate, alongside the Decred Market Cap, Realized Cap, and 142-Day Cap:

From our previous analysis within and this chart, we can make the following takeaways:
Adjusted HODLer Conversion Rates generally flip bullish / bearish before we get a bullish / bearish Realized Cap & 142-Day Cap cross. A bull / bear flip of either of the two should be strongly considered for potential changes in market direction
Both the (1) Realized Cap & 142-Day Cap cross and (2) the Adjusted HODLer Conversion Rate show that the summer 2018 run up was a speculative bubble driven by short term traders, and that early 2018 did indeed mark the beginning of a prolonged bear market
The Realized Cap & 142-Day Cap cross is useful because it shows directional bias from a cost-basis perspective
The Adjusted HODLer Conversion Rate is useful because it shows directional bias from a transactional-momentum perspective
The exploration of the relationship between HODLers, Accumulators, and Capitulators of Decred Network is still young, but hopefully this piece helped highlight that there’s a significant relationship between these parties, and worth further exploring in the future.
Signing out,
HUGE thank you to Checkmate for providing ticket pool size data, initial feedback on the HODLer Conversion Rates, and detail reviewing this piece.


Comments ()